
Candlestick Patterns - Bullish Candlestick Patterns
Inverted Hammer
The Inverted Hammer candlestick pattern is a significant reversal signal in technical analysis, typically appearing after a downtrend. This pattern is characterized by a small body located at the lower end of the trading range, with a long upper wick that is at least twice the length of the body. Understanding how to identify and trade the Inverted Hammer can enhance your trading strategy and improve your chances of success. In this guide, we will explore the characteristics of the Inverted Hammer pattern, how to identify it, and effective trading strategies.
What is the Inverted Hammer Candlestick Pattern?
The Inverted Hammer candlestick pattern signals a potential bullish reversal after a downtrend. It indicates that despite selling pressure during the trading session, buyers managed to push the price up significantly before the session closed near the opening price. This behavior suggests a shift in market sentiment from bearish to bullish.
Key Features of the Inverted Hammer Pattern
- Small Body: The body of the Inverted Hammer is relatively small and can be either bullish (green or white) or bearish (red or black).
- Long Upper Wick: The upper wick should be at least twice the length of the body, illustrating strong buying pressure during the session.
- Location: The Inverted Hammer appears after a downtrend, signaling a potential reversal.
How to Identify the Inverted Hammer Pattern
Structure of the Inverted Hammer
- Downtrend Preceding the Inverted Hammer: Look for a clear downtrend in price action leading up to the formation of the Inverted Hammer.
- Formation of the Candlestick: The price opens lower, trades down, but then rallies significantly to form a long upper wick, closing near the open.
- Volume Consideration: Volume accompanying the Inverted Hammer can provide further confirmation of the reversal. Higher volume during the formation of the Inverted Hammer increases its significance.
Types of Inverted Hammers
- Regular Inverted Hammer: This appears in a downtrend and signals a bullish reversal.
- Shooting Star: This is similar in appearance but typically occurs after an uptrend and indicates a potential bearish reversal.
Trading the Inverted Hammer Pattern
Entry Strategy
- Entry After Confirmation: Enter a trade when the price breaks above the high of the Inverted Hammer candlestick. This breakout confirms the reversal signal.
Setting Stop Loss
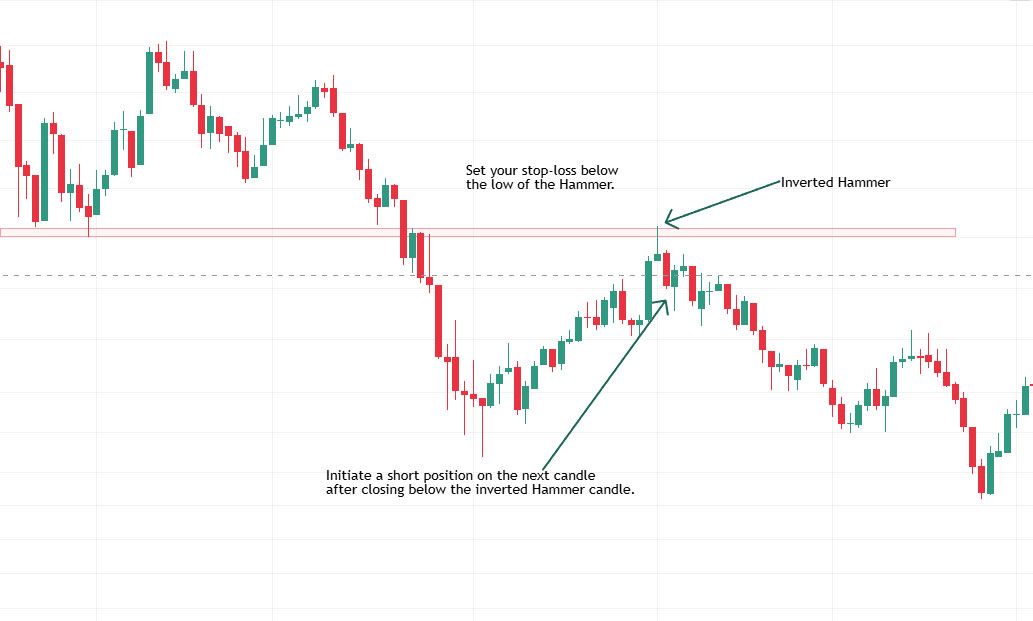
- Stop Loss Placement: Set your stop loss below the low of the Inverted Hammer. This protects against false breakouts and helps manage risk.
Determining Target Price
- Target Calculation: Measure the distance from the open to the high of the Inverted Hammer and project this distance upward from the breakout point to establish your target price.
Example Calculation
If the Inverted Hammer has a high of $60 and a low of $50, with the closing price at $55, measure the distance from the low to the high ($10). If the price breaks above the Inverted Hammer at $60, set your target at $70 ($60 + $10).
Risk Management in Trading
Importance of Risk-Reward Ratio
Implementing a solid risk management strategy is crucial for successful trading. Aim for a risk-reward ratio of at least 1:2 or better. For example, if your stop loss is set at $3 below your entry, target a price that is at least $6 above your entry.
Position Sizing
Determine your position size based on your overall trading strategy and risk tolerance. Proper position sizing helps manage exposure and ensures that no single trade has a detrimental impact on your capital.
Tips for Successful Trading
-
Use Additional Indicators: Incorporate other technical indicators, such as RSI (Relative Strength Index) or MACD (Moving Average Convergence Divergence), to confirm bullish momentum and enhance your trading decisions.
-
Assess Market Context: Always consider the overall market conditions; the Inverted Hammer pattern is more effective in bullish market environments. Understanding broader market trends can enhance your trading success.
-
Be Patient: Wait for confirmation of the bullish reversal after the Inverted Hammer before entering a trade. Avoid rushing into trades to minimize losses.
Example Trade Setup
-
Identify the Pattern: Look for the formation of an Inverted Hammer on a daily chart following a downtrend.
-
Confirm with Volume: Ensure that the volume during the formation of the Inverted Hammer is significant.
-
Enter the Trade: Once the price breaks above the high of the Inverted Hammer at $60 with strong volume, enter a long position.
-
Set Stop Loss: Place your stop loss at $49 (below the low of the Inverted Hammer).
-
Determine Target Price: Measure the height of the Inverted Hammer ($10) and set your target price at $70 ($60 + $10).
Conclusion
The Inverted Hammer candlestick pattern is a valuable tool for traders looking to identify potential bullish reversals after a downtrend. By following a systematic approach to identifying the pattern, managing risk effectively, and confirming with volume and other indicators, you can enhance your trading strategy and increase your chances of success. Always practice sound risk management and adapt your strategy based on prevailing market conditions. Happy trading!
Disclaimer: This article is for educational purposes only and should not be considered financial advice. Read our full disclaimer.