
Harmonic Patterns - Harmonic Patterns
Gartley Pattern
The Gartley Pattern is a powerful harmonic chart pattern that helps traders identify potential reversal zones with high accuracy. It was introduced by H.M. Gartley in his book Profits in the Stock Market and later refined by other analysts using Fibonacci ratios. The Gartley pattern is widely used in forex, stock, and crypto trading. Recognizing this pattern and using it in combination with Fibonacci retracements and extensions can enhance your trade timing and accuracy. In this guide, we’ll break down what the Gartley Pattern is, how to identify it, and how to trade it effectively.
What is the Gartley Pattern?
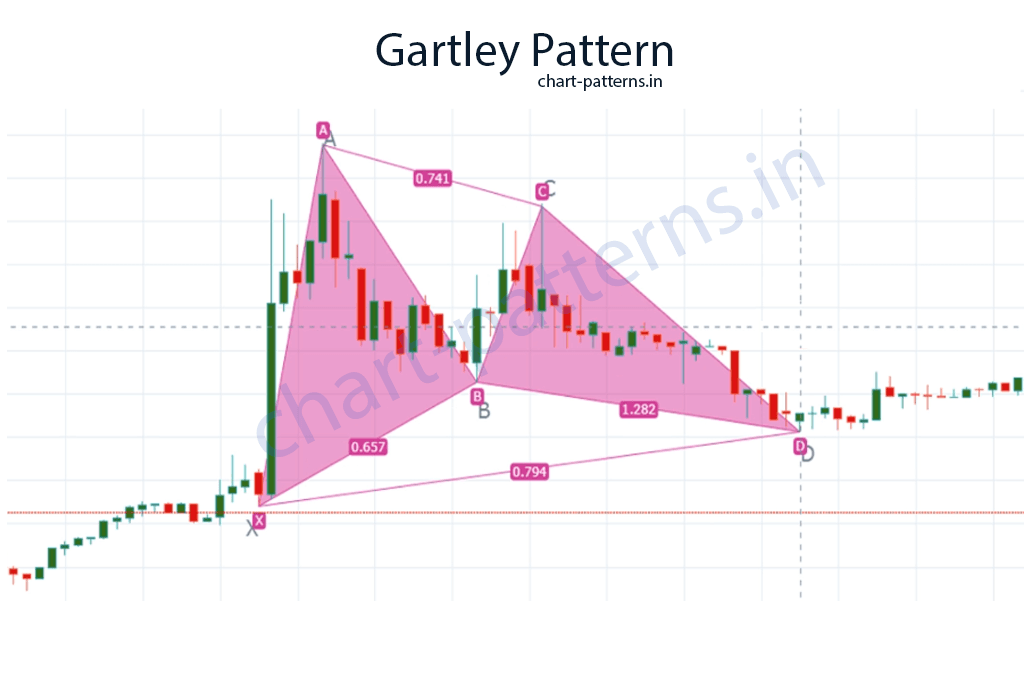
The Gartley Pattern is a harmonic chart pattern that represents a retracement and continuation structure, showing temporary price corrections before the trend resumes. It consists of five points (X, A, B, C, and D), forming a shape that resembles the letter “M” in bullish setups or “W” in bearish setups.
There are two types of Gartley patterns:
- Bullish Gartley Pattern: Suggests a price increase after the pattern completes.
- Bearish Gartley Pattern: Indicates a price decline after the pattern completes.
Key Fibonacci Levels
What makes the Gartley pattern unique is its reliance on Fibonacci ratios:
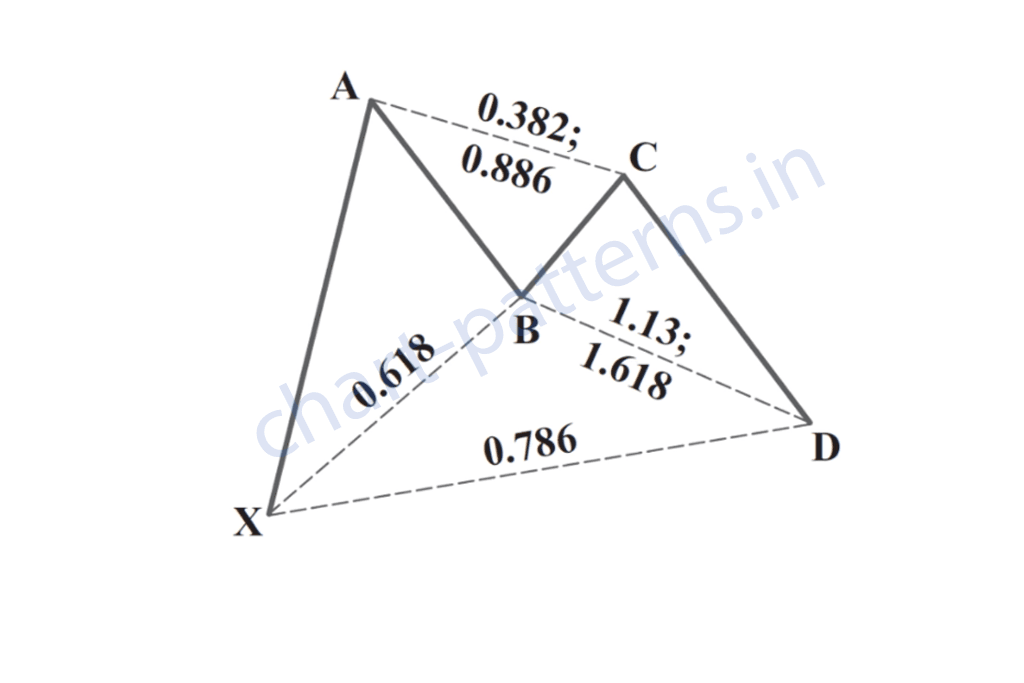
- AB should retrace 61.8% of the XA leg.
- BC should retrace 38.2% to 88.6% of the AB leg.
- CD should be 127.2% to 161.8% extension of the BC leg.
- The final point D is ideally a 78.6% retracement of the XA leg.
How to Identify the Gartley Pattern
Structure of the Gartley Pattern
- XA Leg: A strong initial move up or down.
- AB Leg: A retracement of the XA leg, typically 61.8%.
- BC Leg: A corrective move in the opposite direction of AB, retracing 38.2% to 88.6% of AB.
- CD Leg: The final leg, extending 127.2% to 161.8% of BC.
- Point D: The potential reversal zone (PRZ), usually at 78.6% of the XA leg.
Volume and Confirmation
Volume is not always a key element in harmonic patterns, but you can still confirm setups using:
- RSI Divergence: If RSI shows divergence at point D, it confirms a potential reversal.
- MACD Crossovers: Look for bullish or bearish crossovers near point D.
- Support and Resistance: If point D aligns with a key level, it adds confluence.
Trading the Gartley Pattern
Entry Strategy
- Enter at Point D: This is where the pattern completes and a reversal is expected. Use price action signals like pin bars or engulfing candles for confirmation.
Setting Stop Loss
- Below/Above Point X: For bullish patterns, place a stop loss below point X. For bearish patterns, place it above point X.
Determining Target Price
You can set multiple target levels based on Fibonacci retracement of the AD leg:
- Target 1: 38.2% retracement of the AD leg.
- Target 2: 61.8% retracement of the AD leg.
Example Calculation
If point X is at $100, A at $120, and D forms at $107.8 (a 78.6% retracement), your first target could be around $112 (38.2% of AD) and second around $115 (61.8% of AD).
Risk Management in Trading
Importance of Risk-Reward Ratio
Aim for a risk-reward ratio of at least 1:2. For instance, if your stop loss is $2 below point D, ensure your target is at least $4 above for a bullish pattern.
Position Sizing
Calculate how much capital to risk based on your account size and risk percentage (commonly 1–2%). Never over-leverage, even if the setup looks strong.
Tips for Successful Trading
- Combine with Other Tools: Use harmonic patterns alongside trend lines, Fibonacci retracements, and oscillators for stronger signals.
- Avoid in Sideways Markets: The Gartley pattern performs better in trending markets.
- Be Patient: Wait for the pattern to fully form before entering a trade. Entering early can lead to false signals.
- Backtest First: Before trading live, backtest the pattern on historical charts to understand how it behaves in different market conditions.
Example Trade Setup
- Identify the Gartley Pattern: Look for the XA, AB, BC, and CD legs forming according to Fibonacci levels.
- Wait for Completion: Ensure point D is at the 78.6% retracement of XA.
- Look for Confirmation: Use RSI, candlestick patterns, or MACD to confirm reversal at point D.
- Enter the Trade: Place a buy order at point D (bullish) or sell order at D (bearish).
- Place Stop Loss: Set it beyond point X.
- Set Profit Targets: Use Fibonacci retracement of AD for target levels.
Conclusion
The Gartley Pattern is a precise and powerful harmonic setup that allows traders to identify high-probability reversal zones with the help of Fibonacci ratios. By mastering its structure, combining it with other tools, and practicing sound risk management, traders can improve their entries and exits significantly. Always remember to wait for confirmation before executing trades and use stop-loss orders to protect your capital. Incorporating the Gartley pattern into your trading plan can give you a strategic edge in both bullish and bearish markets.
Happy trading and stay disciplined!
Disclaimer: This article is for educational purposes only and should not be considered financial advice. Read our full disclaimer.