
Harmonic Patterns - Harmonic Patterns
Butterfly Pattern
The Butterfly Pattern is a powerful reversal pattern in harmonic trading, often used by technical analysts to identify potential turning points in the market. Developed by Bryce Gilmore and later refined by Scott Carney, this pattern provides precise entry and exit points using Fibonacci ratios. Whether you're a forex, crypto, or stock trader, mastering the Butterfly Pattern can significantly improve your trade accuracy and risk management.
In this detailed guide, we’ll explore what the Butterfly Pattern is, how to identify it correctly, and how to use it to enhance your trading strategy.
What is the Butterfly Pattern?
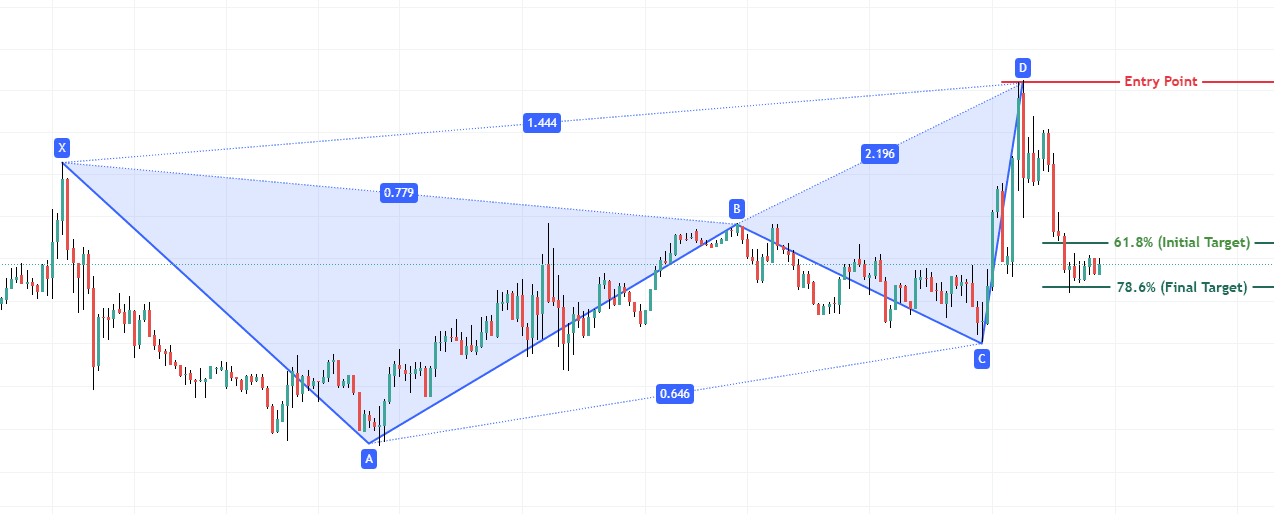
The Butterfly Pattern is a harmonic reversal pattern made up of four legs labeled XA, AB, BC, and CD. It signifies a potential reversal zone (PRZ) at point D, where the price is expected to change direction. The Butterfly Pattern can be both bullish (signals price reversal to the upside) and bearish (signals price reversal to the downside).
Key Characteristics of the Butterfly Pattern
- It is a complete reversal pattern, not a continuation pattern.
- The most distinguishing feature is that point D extends beyond the starting point X.
- The ideal completion point (D) lies at a 127.2% or 161.8% Fibonacci extension of the XA leg.
How to Identify the Butterfly Pattern
Structure and Fibonacci Levels
- XA Leg: The initial price movement from point X to point A.
- AB Leg: Retraces 78.6% of the XA leg.
- BC Leg: Retraces 38.2% to 88.6% of AB.
- CD Leg: Extends to 161.8% to 261.8% of BC and 127.2% to 161.8% of XA.
Fibonacci Summary Table
| Leg | Ideal Fibonacci Level |
|---|---|
| AB | 78.6% of XA |
| BC | 38.2% – 88.6% of AB |
| CD | 127.2% – 161.8% of XA and 161.8% – 261.8% of BC |
Volume and Indicators
Although the Butterfly Pattern is primarily based on price action and Fibonacci ratios, additional confirmation from volume and indicators can strengthen your analysis:
- RSI Divergence: Look for divergence at point D.
- MACD Crossover: A bullish or bearish crossover near D adds confirmation.
- Candlestick Patterns: Watch for reversal candlestick patterns like doji, pin bar, or engulfing candle at D.
How to Trade the Butterfly Pattern
Entry Strategy
- Enter at Point D: This is the reversal zone. Confirm the trade setup using candlestick patterns and technical
Disclaimer: This article is for educational purposes only and should not be considered financial advice. Read our full disclaimer.