
Chart Patterns - Reversal Patterns
Inverse Head and Shoulders Patterns
The Inverse Head and Shoulders pattern is a bullish reversal pattern that typically signals the end of a downtrend and the beginning of an uptrend. This pattern is widely recognized by traders and is considered one of the most reliable reversal patterns in technical analysis. Understanding how to identify and trade this pattern can greatly enhance your trading strategy. In this guide, we will explore the structure, identification, trading strategies, risk management, and tips for successful trading of the Inverse Head and Shoulders pattern.
1. Identifying the Pattern
Structure:
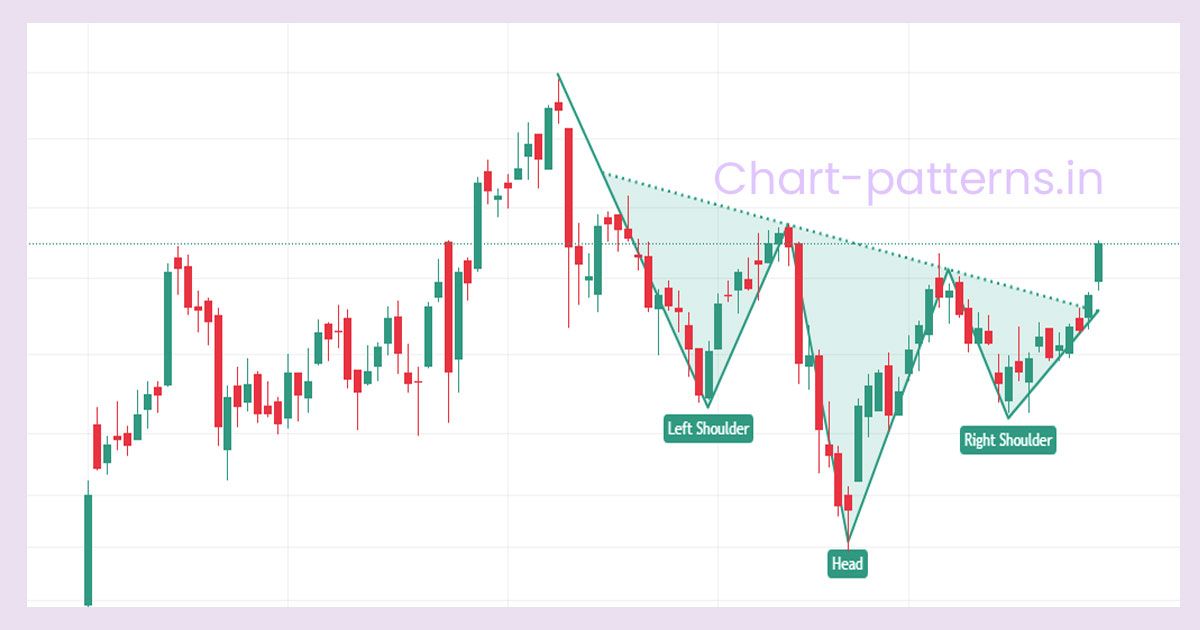
The Inverse Head and Shoulders pattern consists of three distinct troughs:
- Left Shoulder: The price drops to a low, forming the first trough, and then rises again.
- Head: The price falls again, dropping to a lower low than the left shoulder, and then rises, creating the second and deepest trough.
- Right Shoulder: The price drops to a low that is similar to the left shoulder and then rises again, completing the pattern.
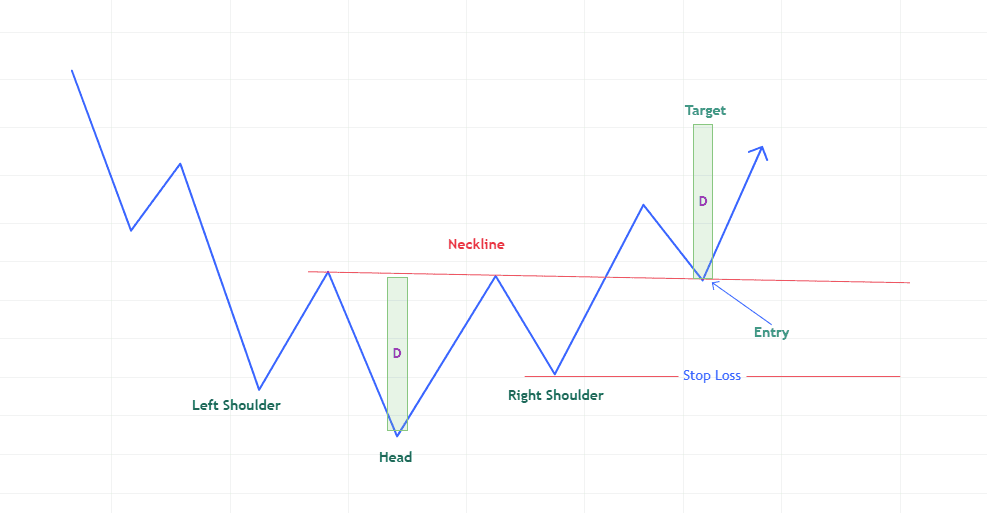
Neckline:
The neckline is an important aspect of the Inverse Head and Shoulders pattern. It is drawn by connecting the highs of the left and right shoulders. This line acts as a resistance level, and its breakout is crucial for confirming the pattern.
2. Detailed Pattern Identification
Formation Criteria:
To accurately identify the Inverse Head and Shoulders pattern, look for the following characteristics:
- The formation of three distinct troughs: left shoulder, head, and right shoulder.
- The head must be the lowest point, while the left and right shoulders should be higher and approximately equal in height.
Volume Analysis:
Volume plays a key role in confirming the validity of the pattern:
- During the formation of the head, volume typically spikes, indicating strong selling pressure.
- Volume generally decreases during the formation of the right shoulder.
- A significant increase in volume when the price breaks above the neckline is a strong confirmation signal.
Time Frame:
The Inverse Head and Shoulders pattern can appear on various time frames (e.g., hourly, daily, weekly). However, it tends to be more reliable when formed on higher time frames, where market dynamics are more stable.
3. Trading the Inverse Head and Shoulders
Entry Point:
- Entry After Breakout: The ideal entry point is when the price breaks above the neckline with increased volume. A confirmed breakout is essential; traders should look for a close above the neckline rather than a brief spike.
Stop Loss:
- Placement: To protect against false breakouts, set your stop loss below the most recent low—either the lowest point of the right shoulder or the head. This strategic placement helps minimize potential losses.
Target Price:
- Measuring the Pattern: Measure the distance from the lowest point of the head to the neckline. This distance can then be projected upwards from the breakout point (the neckline) to establish a target price.
Example:
If the head forms at $50 and the neckline is at $60, the distance is $10. Thus, if the price breaks above the neckline at $60, the target would be set at $70 ($60 + $10).
4. Risk Management
Risk-Reward Ratio:
A sound risk management strategy is vital for successful trading. Aim for a risk-reward ratio of at least 1:2 or better. For instance, if your stop loss is $5 below your entry point, target a price that is at least $10 above your entry.
Position Sizing:
Determine your position size based on your overall trading strategy and risk tolerance. This will help manage exposure and ensure that no single trade significantly impacts your capital.
5. Tips for Successful Trading
-
Confirm with Other Indicators: Utilize additional technical indicators such as RSI (Relative Strength Index) or MACD (Moving Average Convergence Divergence) to confirm bullish momentum.
-
Market Context: Consider the overall market conditions; the Inverse Head and Shoulders pattern is more effective in bullish market environments. Analyzing broader market trends can enhance your trade's success rate.
-
Patience: Exercise patience and wait for the price to confirm the breakout above the neckline before entering a trade. Rushing into a trade can lead to unnecessary losses.
6. Example Trade Setup
-
Identify the Pattern: Look for the formation of an Inverse Head and Shoulders on a daily chart.
-
Draw the Neckline: Connect the highs of the left and right shoulders to establish the neckline.
-
Enter Trade: Once the price breaks above the neckline at $60 with strong volume, enter a long position.
-
Set Stop Loss: Place your stop loss at $55, which is below the right shoulder.
-
Determine Target: Measure the distance from the head to the neckline ($10) and add this to the breakout point ($60) to set a target at $70.
Conclusion
The Inverse Head and Shoulders pattern can be a powerful signal for traders looking to capitalize on potential trend reversals. By following a systematic approach to identifying the pattern, managing risk, and confirming with volume and other indicators, you can enhance your trading strategy and increase your chances of success. Always remember to practice sound risk management and adapt your strategy based on prevailing market conditions. Happy trading!
Disclaimer: This article is for educational purposes only and should not be considered financial advice. Read our full disclaimer.