
Candlestick Patterns - Bullish Candlestick Patterns
Morning Star
The Morning Star is a significant bullish reversal candlestick pattern that typically appears at the bottom of a downtrend. This pattern consists of three candles: a bearish (red) candlestick, a small-bodied candle (which can be bullish or bearish), and a larger bullish (green) candlestick. Understanding how to identify and trade the Morning Star can enhance your trading strategy and improve your chances of success. In this guide, we will explore the characteristics of the Morning Star pattern, how to identify it, and effective trading strategies.
What is the Morning Star Pattern?
The Morning Star pattern signifies a potential reversal from bearish to bullish sentiment. It indicates that buyers are starting to take control after a downtrend, suggesting a shift in market momentum. This pattern is often seen as a strong bullish signal.
Key Features of the Morning Star Pattern
- Three Candlesticks: The pattern consists of a bearish candlestick followed by a small-bodied candlestick and a larger bullish candlestick.
- Location: The Morning Star pattern typically forms after a downtrend, signaling a potential reversal.
- Volume Consideration: Increased volume during the formation of the bullish candlestick enhances the strength of the signal.
How to Identify the Morning Star Pattern
Structure of the Morning Star
- Downtrend Preceding the Pattern: Look for a clear downtrend in price action leading up to the Morning Star pattern.
- Formation of the Candlesticks:
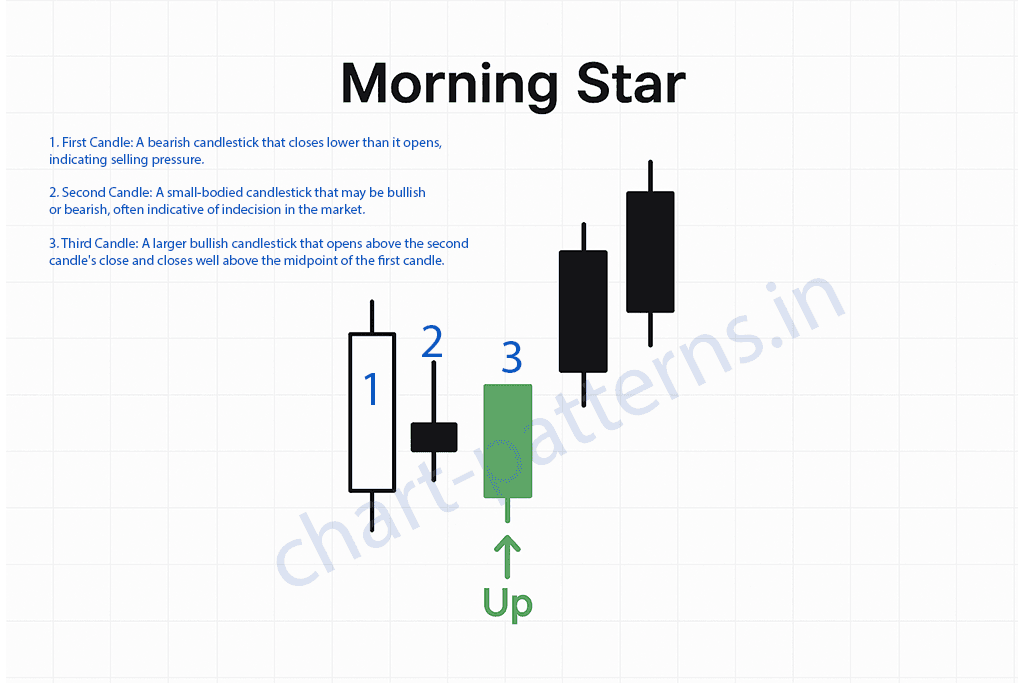
- First Candle: A bearish candlestick that closes lower than it opens, indicating selling pressure.
- Second Candle: A small-bodied candlestick that may be bullish or bearish, often indicative of indecision in the market.
- Third Candle: A larger bullish candlestick that opens above the second candle's close and closes well above the midpoint of the first candle.
- Volume Analysis: Increased volume during the formation of the bullish candlestick adds to the reliability of the pattern, confirming that buyers are entering the market.
Example of Identification
- First Candle: A bearish candle closes lower than it opens, indicating continued selling pressure.
- Second Candle: A small-bodied candle shows indecision, often reflecting a pause in selling.
- Third Candle: A strong bullish candle confirms the shift in momentum, closing significantly higher.
Trading the Morning Star Pattern
Entry Strategy
- Entry After Confirmation: Enter a trade when the price breaks above the high of the bullish candlestick. This breakout confirms the reversal signal.
Setting Stop Loss
- Stop Loss Placement: Set your stop loss below the low of the first bearish candle. This protects against false breakouts and helps manage risk.
Determining Target Price
- Target Calculation: Measure the height of the first candlestick and project this distance upwards from the breakout point to establish your target price.
Example Calculation
If the bearish candlestick has a low of $30 and a high of $50, measure the distance from the low to the high ($20). If the price breaks above the high of the bullish candlestick at $50, set your target at $70 ($50 + $20).
Risk Management in Trading
Importance of Risk-Reward Ratio
Implementing a solid risk management strategy is crucial for successful trading. Aim for a risk-reward ratio of at least 1:2 or better. For example, if your stop loss is set at $5 below your entry, target a price that is at least $10 above your entry.
Position Sizing
Determine your position size based on your overall trading strategy and risk tolerance. Proper position sizing helps manage exposure and ensures that no single trade has a detrimental impact on your capital.
Tips for Successful Trading
-
Use Additional Indicators: Incorporate other technical indicators, such as RSI (Relative Strength Index) or MACD (Moving Average Convergence Divergence), to confirm bullish momentum and enhance your trading decisions.
-
Assess Market Context: Always consider the overall market conditions; the Morning Star pattern is more effective in bullish market environments. Understanding broader market trends can enhance your trading success.
-
Be Patient: Wait for confirmation of the bullish reversal after the Morning Star pattern before entering a trade. Avoid rushing into trades to minimize losses.
Example Trade Setup
-
Identify the Pattern: Look for the formation of a Morning Star pattern on a daily chart following a downtrend.
-
Confirm with Volume: Ensure that the volume during the formation of the bullish candlestick is significant.
-
Enter the Trade: Once the price breaks above the high of the bullish candlestick with strong volume, enter a long position.
-
Set Stop Loss: Place your stop loss at $29 (below the low of the first bearish candle).
-
Determine Target Price: Measure the height of the first candlestick and set your target price based on that measurement.
Conclusion
The Morning Star pattern is a valuable tool for traders looking to identify potential bullish reversals after a downtrend. By following a systematic approach to identifying the pattern, managing risk effectively, and confirming with volume and other indicators, you can enhance your trading strategy and increase your chances of success. Always practice sound risk management and adapt your strategy based on prevailing market conditions. Happy trading!
Disclaimer: This article is for educational purposes only and should not be considered financial advice. Read our full disclaimer.